Einordnung
This page is for production and plant management — for everyone responsible for a line who needs to know why it runs differently today than yesterday. The surface behind it is described under Platform.
Your day
- Scrap at the end of the line
- Final inspection finds the defect. Nobody knows where it was created.
- Downtime with idle staff
- Every hour of unplanned downtime costs the line, the people on it and the restart.
- Data in separate systems
- Controller, MES, historian and cameras all record — each on its own. So far a person makes the connection.
- The same failure, again
- It comes back, and every time the search starts from scratch.
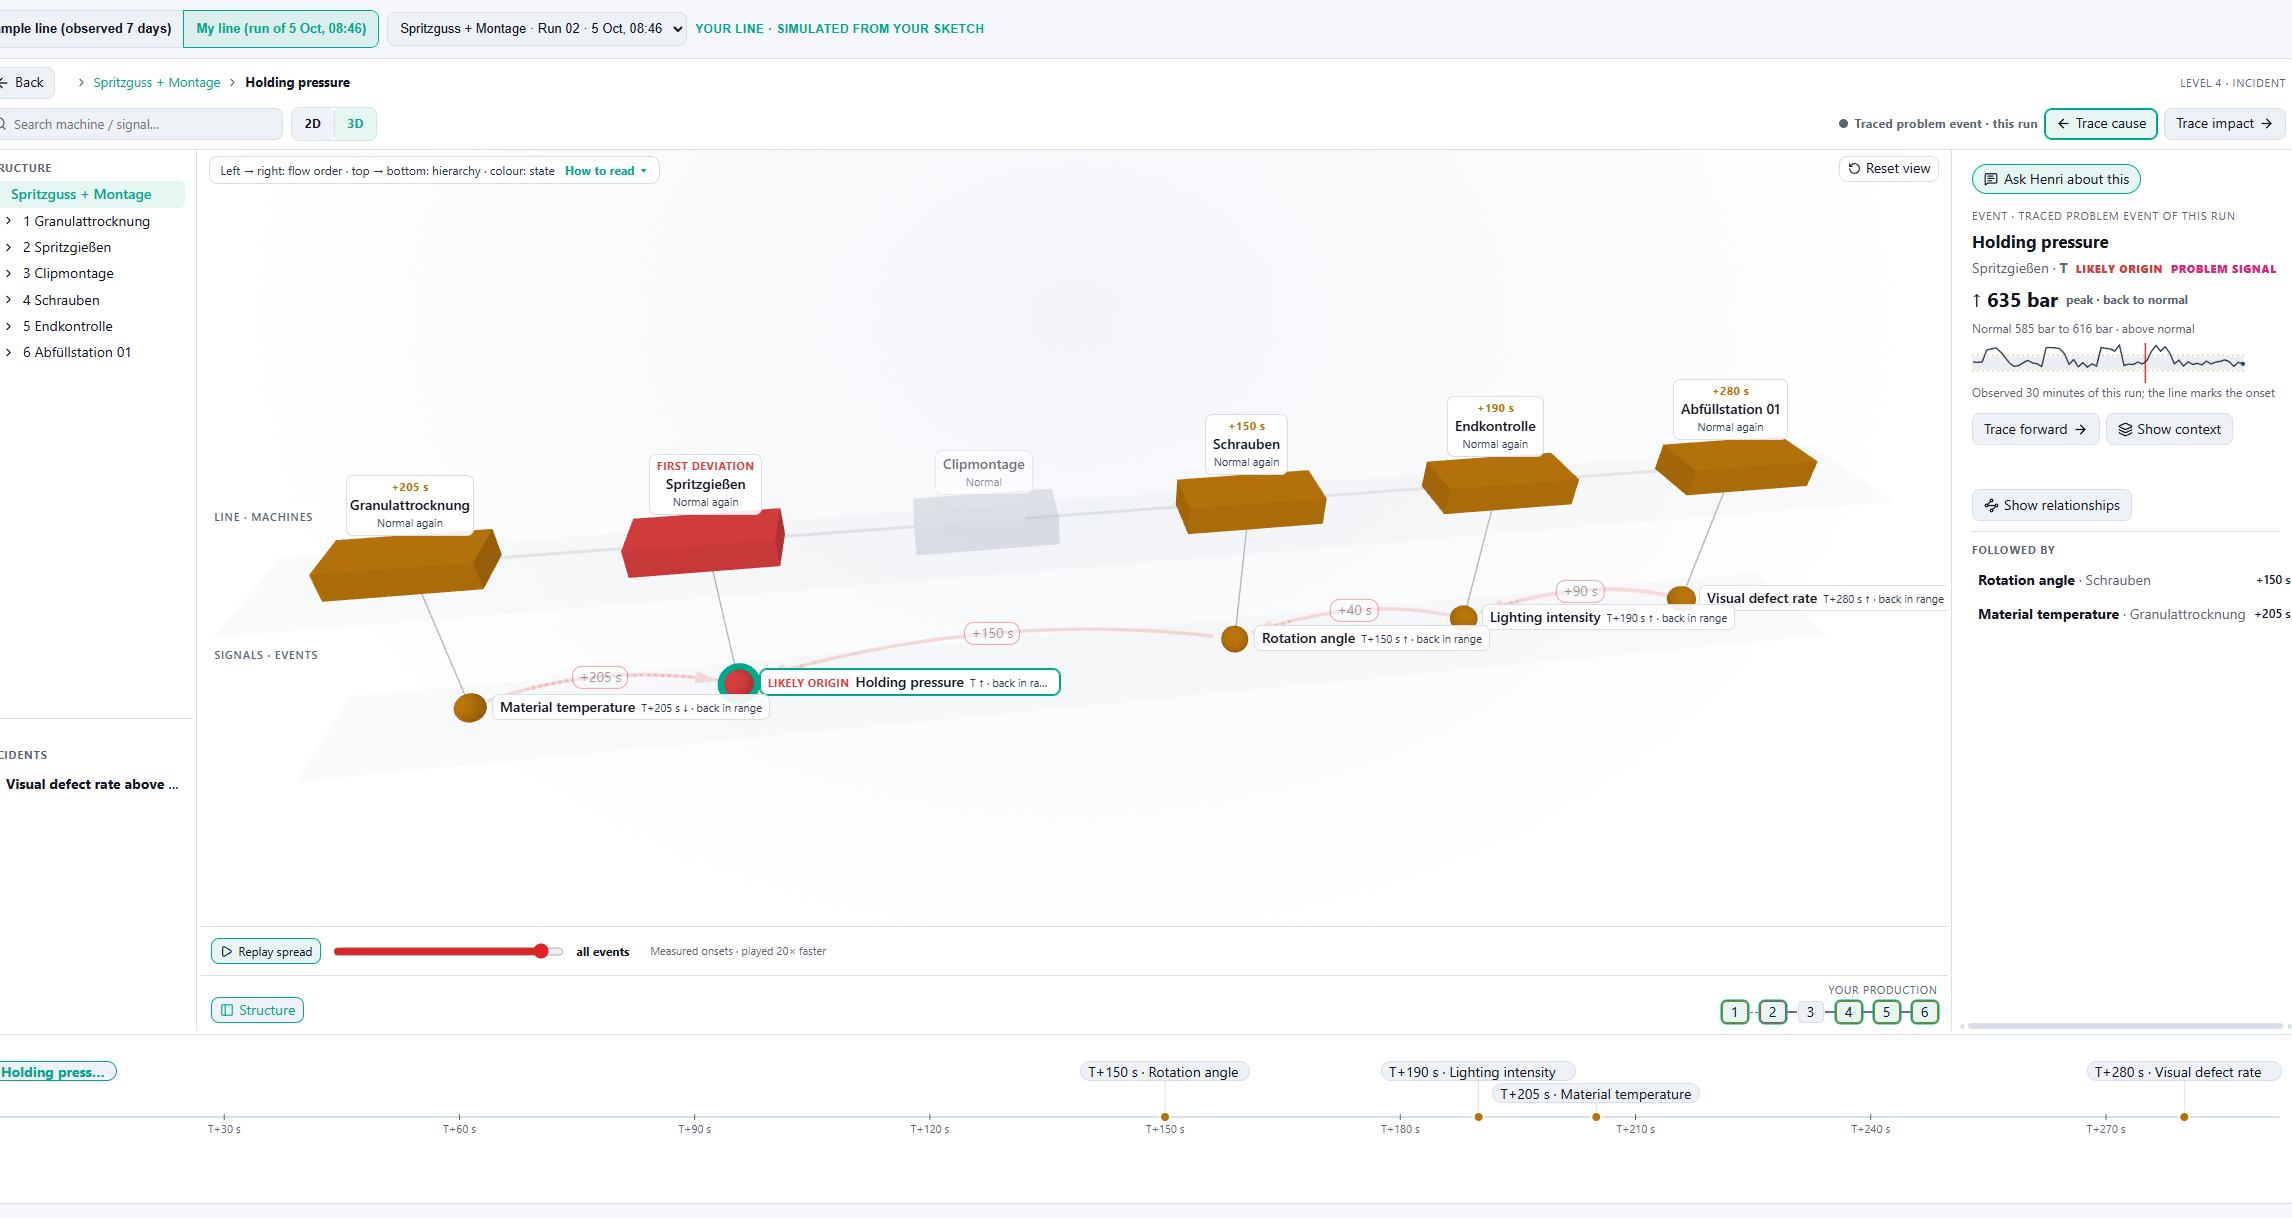
What SAIP shows you
- The first deviation: The stations of your line in flow order — and where something changed first, with reading and normal range.
- The spread: What followed, in the order it happened, with the time in between. A relationship is shown as a hypothesis, never as a proven cause.
- One surface for the line: Every connected machine and data source in the same surface — not one tool per system, each with its own login.
The offer for this
Process AI
SAIP with Process AI — on-site at your controller.
- Read-only connection to your controller — no controller swap, no change to machine logic
- Explained alarms: sensor, reading, expected value and direction
- Runs on your hardware, air-gap capable, no cloud
- Way in: free data check, then a fixed-price pilot
What can be shown today
SurfaceExisting — connected machines and data sources in one surface
DetectionExisting — deviation against the learned normal range per signal
Intervention in the controllerNone — read-only access, the controller program stays unchanged
OperationExisting — on-site, air-gap capable, no cloud
What is still to come
Patterns across orders, shifts and periodsRoadmap — Production AI, release 2027
What we do not promise
We quote no savings in advance. You know better than we do what an hour of downtime costs on your line — the pilot measures it on your equipment, before and during. Even when the answer is: not worth it.
How to start
With a pilot on the line whose failures cost you the most today. Fixed price, four phases, agreed in writing before the start.